01
Data Analytics
Transforming complex operational data into clear, actionable insights through Python, Excel, and BI.
Reza Novandiar
Data Analytics | Logistics & Supply Chain | AI Engineering
Connecting logistics experience with data analytics, while developing practical AI engineering skills.

Driven by data, inspired by technology, and powered by creativity.
My background combines logistics operations, transportation planning, and operational data analytics. I use Python, Excel, Power BI, and SQL to transform operational data into meaningful insights, monitor KPIs, and support data-driven decision-making.
My experience in contract logistics, HSSE, operational quality, and process improvement has shaped a practical, analytical approach to problem-solving.
Beyond logistics, I continuously expand my expertise in data science, data visualization, and AI engineering, while exploring visual storytelling through videography and visual design. I bring together analytical thinking, technology, and creativity to turn complex ideas into meaningful outcomes.
A multidisciplinary approach to operational challenges, digital solutions, and creative work.
Transforming complex operational data into clear, actionable insights through Python, Excel, and BI.
Connecting transportation planning, delivery execution, process improvement, and operational excellence.
Applying risk assessment, root-cause analysis, SOPs, and continuous improvement to real-world operations.
Building practical skills in data pipelines, Python development, and applied AI workflows.
Combining photography, videography, and thoughtful visual composition with analytical thinking.
Designing repeatable reporting workflows that reduce manual work and improve decision quality.
Case studies and projects bridging logistics, analytics, process improvement, and visual communication.
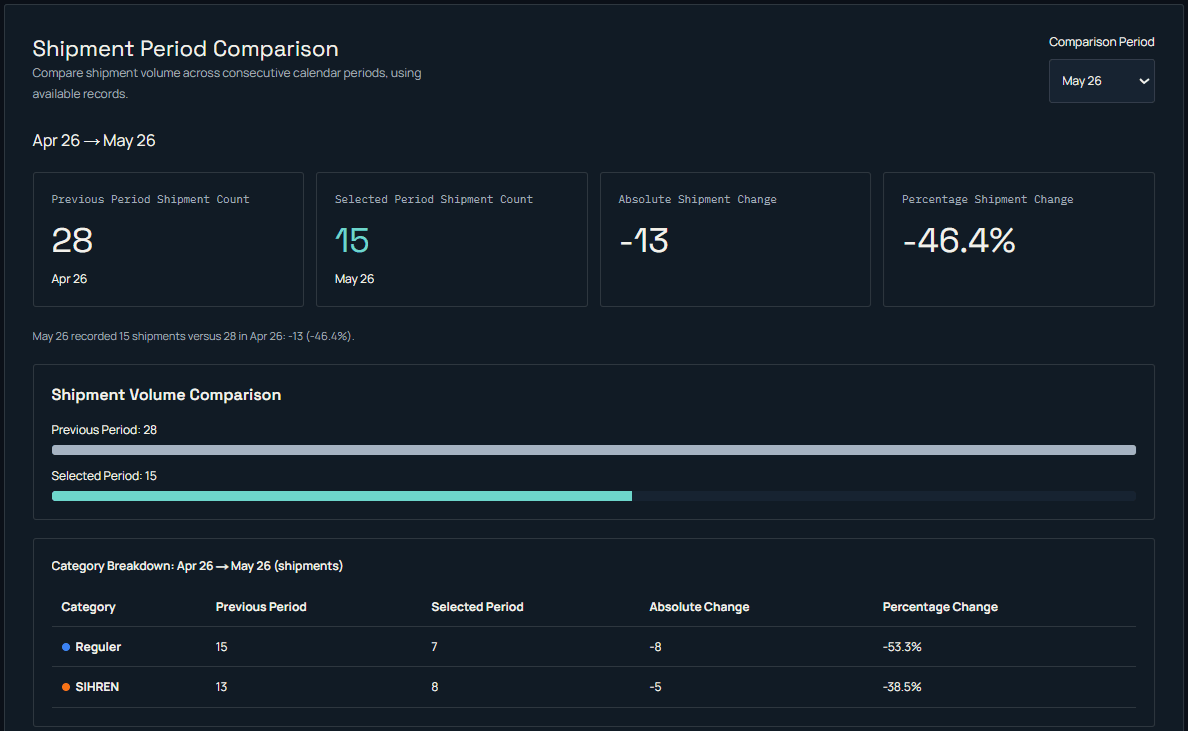
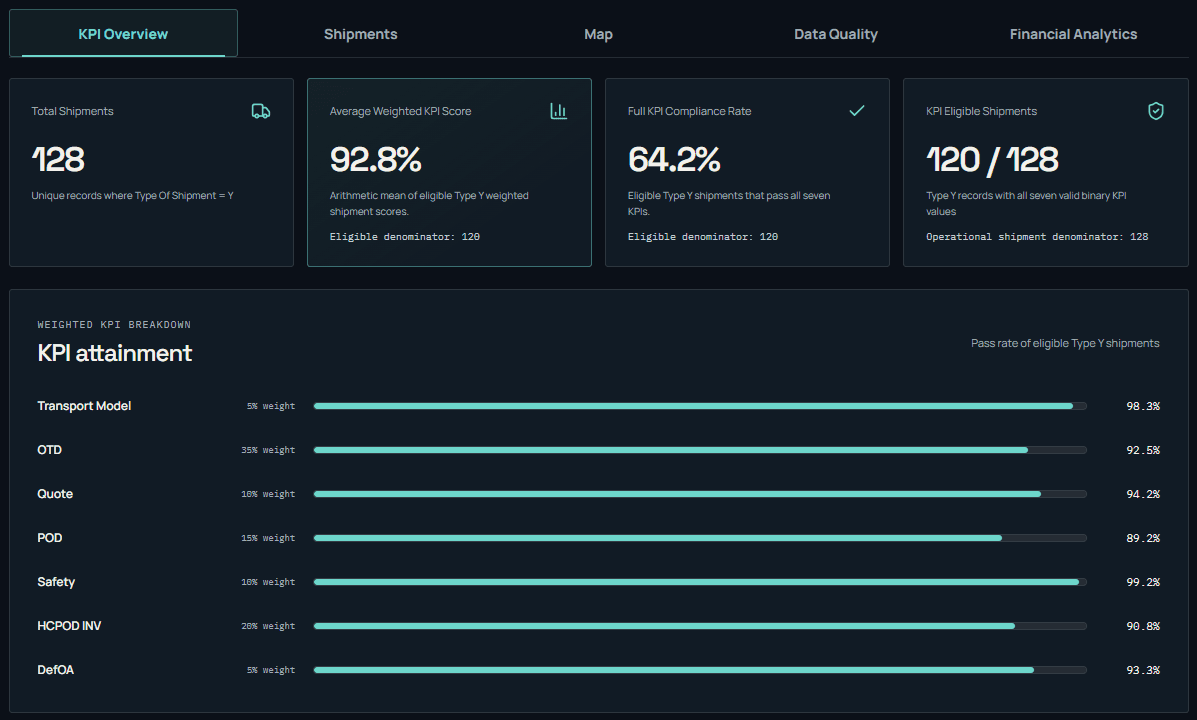
An interactive logistics analytics dashboard combining shipment monitoring, KPI performance, financial analysis, geographic insights, and data quality reporting.
Built with synthetic demonstration data for an interactive, privacy-conscious portfolio experience.
Python · Excel · Power BI · SQL
Next.js · TypeScript · Tailwind CSS · Leaflet
Browser-local Excel processing
Cinematic Work
A cinematic look at professional work activities.
Part of the Logistics Data Analytics & Reporting dashboard: explore shipment locations using available coordinates, without destination geocoding.
Explore Interactive DashboardBridging logistics and supply chain operations with data analytics, Python-powered visualization, and videography to transform complex processes into actionable insights, compelling visual stories, and meaningful outcomes.
PT Sinotrans Overseas Indonesia
Coordinate logistics operations and distribution activities.
Plan transportation and deliveries around operational requirements.
Analyze operational data, monitor KPIs, and prepare performance reports using Python, Excel, Power BI, and SQL.
Coordinate with vendors and stakeholders to support delivery execution.
Support operational safety and quality through HSSE practices and quality reviews.
Apply standard operating procedures and root-cause analysis to support process improvement.
Open to professional opportunities and on-site or remote collaboration in data analytics, logistics, and supply chain. Connect with me on LinkedIn to start a conversation.