Fragmented logistics and delivery performance information makes monitoring and operational evaluation difficult.
Contribution
Data preparation, KPI analysis, dashboard design, reporting, and operational interpretation, demonstrated through this portfolio implementation.
Tools
Professional analytics tools
Python · Excel · Power BI · SQL
Public dashboard implementation
Next.js · TypeScript · Tailwind CSS · Leaflet
Browser-local Excel processing
Deliverable
Interactive Delivery Performance Dashboard and an operational reporting framework with documented metric and validation rules.
Evidence
Working public synthetic-data dashboard, documented KPI methodology, and logistics operations experience. No operational adoption or measured business gains are claimed.
PUBLIC PREVIEW / SYNTHETIC DATA
Illustrative KPI snapshot
Demo Data · Synthetic only
These figures are generated solely to demonstrate the interface. They do not come from a workbook, client, or real operation and are not business outcomes.
Turning shipment records into a transparent analytics workflow.
This project demonstrates a private, client-side workflow for reviewing shipment performance using seven weighted binary KPIs. It combines a local Excel upload dashboard with a separate public case-study preview that uses synthetic values only.
The dashboard opens in synthetic Demo Data without an upload. Select a compatible Excel workbook for private local analysis.
Use a standard unencrypted XLSX workbook. Its first worksheet must include Type Of Shipment and the seven required KPI headers. Existing file-name validation applies. Workbook compatibility
02 / BUSINESS CHALLENGES
Make operational reporting easier to inspect.
Shipment workbooks can mix delivery dates, operational metadata, and pass/fail indicators. The project addresses the reporting-design challenge: keep a consistent KPI definition, make records explorable, surface validation context, and avoid moving private source data outside the browser.
This is a portfolio capability description, not a claim that a particular company adopted the system or achieved a measured operational result.
03 / OBJECTIVES
Build a clear, private, and inspectable analytics experience.
Keep KPI definitions and eligibility rules consistent across the dashboard.
Make shipment records, trends, comparisons, and validation findings explorable.
Keep local workbook processing in the browser and separate it from synthetic public demo data.
04 / MY ROLE & CONTRIBUTIONS
Designed and implemented as a portfolio project.
My contribution covers the end-to-end portfolio implementation: translating the reporting workflow into a bilingual interface, implementing client-side analysis features, and documenting metric definitions and validation behavior.
Built the responsive Next.js and TypeScript portfolio and dashboard experience.
Implemented local-first workbook analysis, interactive visualizations, and data-quality review.
Created a separate synthetic public preview and documented privacy boundaries.
05 / DATA SOURCES & PROCESSING WORKFLOW
A clear path from workbook to analysis.
The local workflow uses a workbook explicitly selected by the user. Public-facing preview figures are independently synthetic and are not sourced from a workbook.
01
Local workbook import
The selected .xlsx is read in the browser. The first worksheet is parsed read-only; source data is not uploaded or persisted.
02
Type Y scope and source-row preservation
Shipment type is trimmed and case-normalized to Y. Every nonblank Type Y row is a separate job, including identical rows and repeated shipment identifiers.
03
Validation and eligibility
Operational quality findings are calculated separately. Only the seven official KPI fields determine KPI eligibility.
04
Interactive analytics
The filtered in-memory Type Y dataset feeds summary metrics, trends, comparisons, rankings, shipment details, and the coordinate map.
Workbook compatibility
Required first-worksheet headers:
Type Of Shipment
KPI Transport Model
KPI OTD
KPI Quote
KPI POD
KPI Safety
KPI HCPOD INV
KPI DefOA
The current import also checks the existing filename: Data Raw Web.xlsx. Optional operational fields enable additional views. Source files are never provided by this website; use only a workbook you are authorized to analyze locally.
06 / KPI METHODOLOGY
Seven official indicators. One unchanged formula.
Each shipment KPI is binary: 1 is pass and 0 is fail. A shipment is KPI-eligible only when all seven values are valid. Its weighted score is the sum of weights for passing KPIs divided by 100. The average score is the arithmetic mean across eligible shipments; full compliance is the share of eligible shipments passing all seven.
Official KPI names and weights
KPI
Weight
Transport Model
5%
OTD
35%
Quote
10%
POD
15%
Safety
10%
HCPOD INV
20%
DefOA
5%
Total
100%
Missing or invalid KPI values exclude a record from KPI score denominators, while its Type Y shipment remains in operational shipment counts.
KPI Glossary
Owner-confirmed definitions are preserved in their official English wording. These names do not add calculation or eligibility rules.
Official KPI definitions and weights
KPI
Official definition
Weight
Transport Model
Data of Details Transport Model
5%
OTD
On Time Delivery
35%
Quote
Final Quotation Submission
10%
POD
Proof of Delivery Submission
15%
Safety
Health and Safety Delivery
10%
HCPOD INV
Invoice & Hardcopy POD Submission
20%
DefOA
Defect On Arrival
5%
Average Weighted KPI Score
Arithmetic mean of eligible shipment weighted scores. Each shipment score is the sum of passed KPI weights divided by 100.
Full KPI Compliance Rate
Eligible shipments that pass all seven KPIs, divided by all KPI-eligible shipments.
Delivery Success Rate
A separate operational delivery outcome measure. Its result depends on an explicitly defined delivery-status rule; it is not the weighted KPI score or full KPI compliance, and no public demo value is asserted.
07 / DASHBOARD & ANALYTICS OUTPUTS
Designed for exploration, not just snapshots.
Monthly, quarterly, and yearly KPI trends by Actual Delivery Date, with independently toggleable KPI lines.
Bar and radar KPI comparison with official weights.
Workbook-derived vendor, region/province, equipment filters; date filters and interactive group rankings.
Searchable, sortable shipment explorer with pagination and a detail panel.
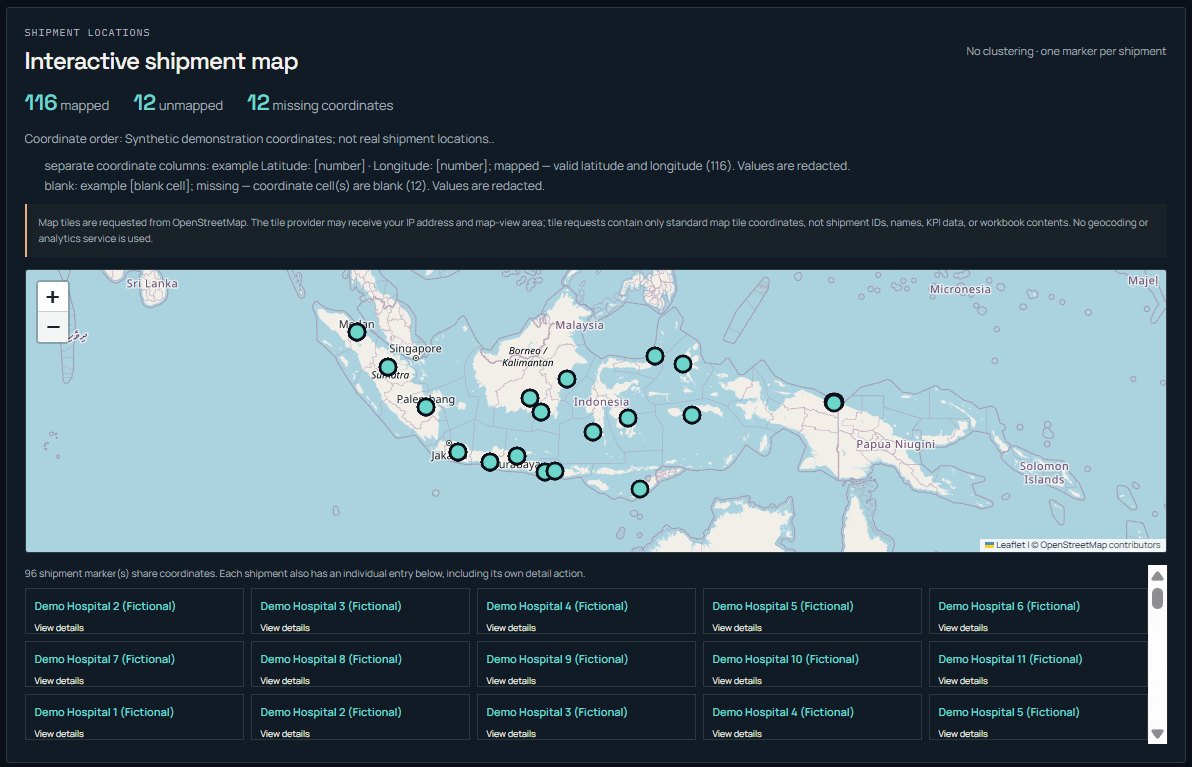
Client-side shipment map for verified workbook coordinates; no destination geocoding.
Shared filters and local workbook state across the four dashboard sections.
Demo Data / Synthetic Data — Geographic Shipment Visualization
Data Quality Validation
Report issues without conflating them with KPI eligibility.
Validation covers available source fields for binary KPI values, missing operational metadata, date validity and chronology, tonnage/CBM, region/province consistency, coordinate parsing, and shipment-status consistency. Findings have separate severity and impact labels, issue counts, trends, filters, and rule-level details. A metadata or map issue does not itself make a shipment KPI-ineligible.
Checks are limited to columns actually present in the workbook. Strict duplicates removed during import are reported separately from the post-dedup Type Y analytical denominator.
No unambiguous equipment field is available from the currently verified source mapping. The dashboard keeps Equipment as N/A rather than inferring it from an item or transport-mode field.
08 / RESULTS & BUSINESS IMPACT
Implemented capabilities, not invented impact metrics.
The deliverable is an interactive portfolio demonstration with local workbook analysis, a separate synthetic public preview, and documented KPI and validation rules.
Business results are not claimed.
No cost savings, time reductions, efficiency gains, client testimonials, or operational improvements have been independently measured or verified for this project.
09 / TECHNOLOGY STACK
A lightweight client-side application.
01Next.js + React
Dashboard routing and interactive client components.
02TypeScript
Typed workbook records, KPI definitions, and analytics helpers.
03Tailwind CSS + CSS
Responsive styling and the established cinematic portfolio design.
04Leaflet
Client-side map rendering using standard map tiles; tile requests do not include shipment fields.
The workbook parser reads .xlsx locally in the browser. Mapping and analytics use the in-memory Type Y dataset, with no server upload endpoint.
10 / EXPLORE INTERACTIVE DASHBOARD
See the local dashboard in action.
The public dashboard starts with synthetic Demo Data and does not require an upload. Local Analysis is optional; select a workbook to process it in your browser. The public case-study preview remains synthetic.